The results for this study are extensive. This page gives highlights.
Survey Phase
The survey contained interval-scale and free-response questions plus a choice of two Best-Worst Scaling (BWS) components. The interval-scale and free-response questions examined student career plans, perceptions of choice difficulty and intentions apropos choosing Science. The BWS component investigated the subject choices made by students by quantifying the relative importance of the factors that Year 10 students consider in their subject choice decision making. The 21 decision-making factors were developed from the findings of the first two phases of Fresh Minds in association with results from similar studies presented in the literature review. The survey also provided an opportunity for students to give advice to the researcher on how to increase enrolments in Science.
The data from this phase showed that students are at different stages of surety concerning their choice of future study path or career and they hold different views on the difficulty of the subject selection process. The relationship between career surety and subject selection difficulty suggests that students who have decided on their career or future study plans select subjects appropriate to this plan and hence found the process easier. The large number of students who had not chosen a career found subject choice more difficult.
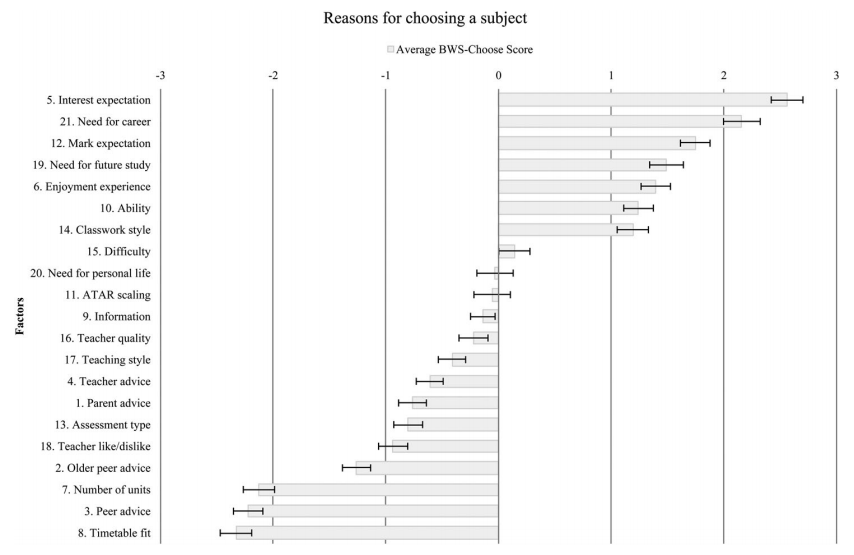
This phase resulted in a list of factors that students considered in their subject selection decision to be constructed and evaluated the relative impact of these factors using BWS. The factors for choice are ranked differently. In addition, these factors are assessed differently depending on whether students were deciding to choose or reject a subject. The BWS analysis showed that students placed relatively little importance on the advice they were given about subject choice. Students also did not rank past and anticipated teaching and logistical issues highly in their deliberations. The graphs of the BWS results are presented below. Each graph shows the 21 factors students considered when choosing their subjects. Each factor has a score and the higher this score, the more often the student chose that factor as their most important factor when compared to other factors. The maximum score is 5 when a student always chose a factor as the most important and -5 if they always chose it as least important.
The top 7 reasons why students chose a subject were:
Interest expectation, Need for career, Difficulty, Need for future study, Enjoyment experience, Ability, and Classwork style
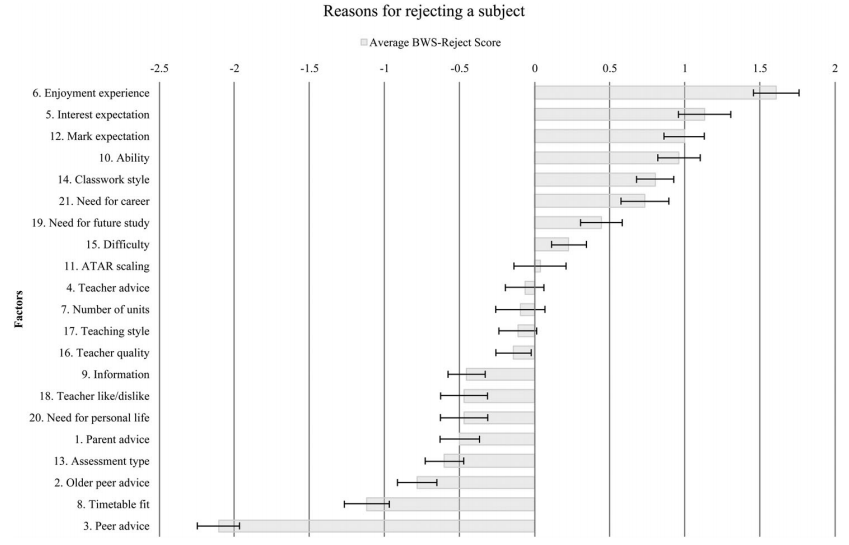
The top 7 reasons students reject a subject were:
Enjoyment experience, Interest expectation, Difficulty, Ability, Classwork style, Need for career, and Need for future study
There is little evidence that male and female students choose subjects in a different manner but there are differences in the level of importance boys and girls place on certain factors. The girls in this study considered past academic performance in a subject as a more important consideration in choosing subjects to reject than boys did.
The next section presents conclusions for Fresh Minds for Science.
The data from this phase showed that students are at different stages of surety concerning their choice of future study path or career and they hold different views on the difficulty of the subject selection process. The relationship between career surety and subject selection difficulty suggests that students who have decided on their career or future study plans select subjects appropriate to this plan and hence found the process easier. The large number of students who had not chosen a career found subject choice more difficult.
This phase resulted in a list of factors that students considered in their subject selection decision to be constructed and evaluated the relative impact of these factors using BWS. The factors for choice are ranked differently. In addition, these factors are assessed differently depending on whether students were deciding to choose or reject a subject. The BWS analysis showed that students placed relatively little importance on the advice they were given about subject choice. Students also did not rank past and anticipated teaching and logistical issues highly in their deliberations. The graphs of the BWS results are presented below. Each graph shows the 21 factors students considered when choosing their subjects. Each factor has a score and the higher this score, the more often the student chose that factor as their most important factor when compared to other factors. The maximum score is 5 when a student always chose a factor as the most important and -5 if they always chose it as least important.
The top 7 reasons why students chose a subject were:
Interest expectation, Need for career, Difficulty, Need for future study, Enjoyment experience, Ability, and Classwork style
The top 7 reasons students reject a subject were:
Enjoyment experience, Interest expectation, Difficulty, Ability, Classwork style, Need for career, and Need for future study
There is little evidence that male and female students choose subjects in a different manner but there are differences in the level of importance boys and girls place on certain factors. The girls in this study considered past academic performance in a subject as a more important consideration in choosing subjects to reject than boys did.
The next section presents conclusions for Fresh Minds for Science.